Initially, we set out the key findings of chapter 6. Note that referencing, data source and context is provided in the body of the chapter.
Key findings
- Average (mean) house price has risen by 32% from 2010 to 2020.
- The increase in the value of flats has lagged behind that of other house types over the period with a 21% increase.
- In 2020/21 the lower quartile rent, considered the entry level to the private rental market, was £495 pcm.
- The lower quartile rent is significantly lower for rooms in shared houses and studio flats, making these properties affordable for smaller households, including single adult households on the lowest incomes.
- There is reported information from the Housing Options team that the private rented sector has seen exceptional increases in rent, particularly in respect of larger family accommodation. These reported increases have not filtered through to official datasets as yet, but there is some evidence at a national level to support a particular impact on private rents in seaside and holiday locations.
- In 2018 nearly 60% of private sector tenants in Torbay were in receipt of housing benefits, which is significantly higher than comparator geographies.
The chapter considers the affordability of the housing stock in Torbay in terms of both the sales and rental market. This builds the picture of the affordability of housing for both the resident and working populations, having considered both resident and workforce earnings within the last chapter. It also provides some comparative information.
First, we consider house prices and house price trends over the last 10 years. The table below reports sales volumes in Torbay from 2011 to 2019. Sales as a percentage of stock have increased relatively consistently from 2011 to 2017 with a slight fall back in 2018 and 2019. Increased sales volumes tend to indicate a more buoyant market with higher demand. More recently sales volumes dipped during lockdown, but in the last six months anecdotally sales demand recovered and is high post lockdown.
| Year | Torbay | % stock |
|---|---|---|
| 2011 | 1948 | 3.05 |
| 2012 | 2033 | 3.18 |
| 2013 | 2418 | 3.78 |
| 2014 | 2825 | 4.42 |
| 2015 | 3097 | 4.84 |
| 2016 | 3000 | 4.69 |
| 2017 | 3167 | 4.95 |
| 2018 | 2862 | 4.47 |
| 2019 | 2722 | 4.26 |
Source: Land Registry 2021
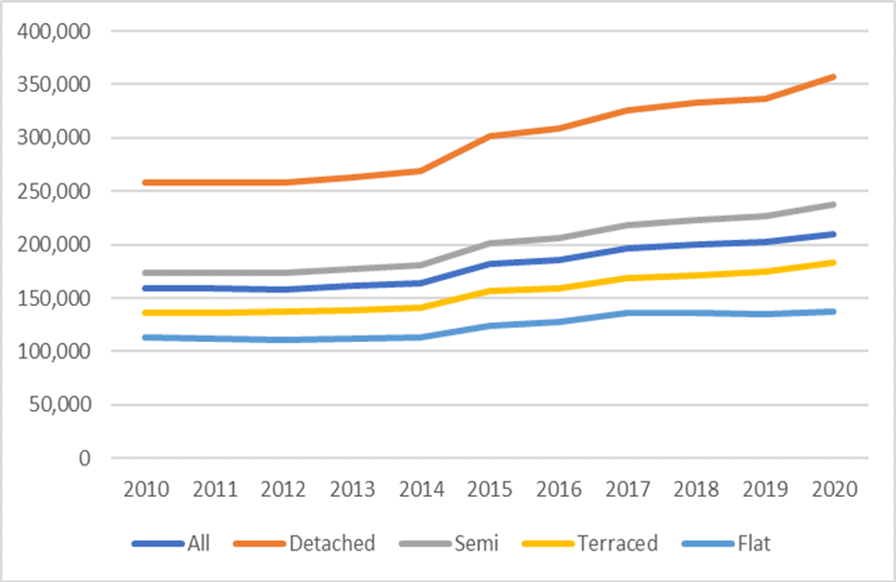
Tables 6.2, 6.3 and Figure 6.1 illustrate average house price values as determined by the Land
Registry’s house price index (HPI) over the last 10 years. The average house price in December 2010 was £159,121. In December 2020 this stood at £210,160. This represents an increase of 32% over the last 10 years.
Detached and semi-detached dwellings saw the greatest increase in values with terraced dwellings not far behind. The increase in the value of flats was a lot lower than other dwelling types at just under 21%. House values experienced a particular jump between 2014 and 2015.
| December of | All (£) | Detached (£) | Semidetached (£) | Terraced (£) | Flat (£) |
|---|---|---|---|---|---|
| 2010 | 159,121 | 257,556 | 173,819 | 136,322 | 113,157 |
| 2011 | 158,776 | 258,595 | 174,046 | 135,639 | 112,239 |
| 2012 | 158,309 | 257,926 | 173,860 | 136,727 | 110,387 |
| 2013 | 161,092 | 263,155 | 177,568 | 138,787 | 111,938 |
| 2014 | 163,376 | 268,528 | 180,171 | 140,850 | 112,670 |
| 2015 | 181,506 | 301,375 | 201,020 | 156,362 | 123,690 |
| 2016 | 185,961 | 309,305 | 205,565 | 158,788 | 127,857 |
| 2017 | 196,920 | 326,000 | 218,364 | 168,314 | 135,512 |
| 2018 | 199,999 | 333,373 | 223,049 | 171,602 | 135,688 |
| 2019 | 201,942 | 336,934 | 226,964 | 174,160 | 135,281 |
| 2020 | 210,160 | 357,219 | 237,759 | 182,851 | 136,771 |
Source: Land Registry 2021
| All | Detached | Semi-detached | Terraced | Flat |
|---|---|---|---|---|
| 32% | 38.70% | 36.80% | 34.10% | 20.90% |
Source: Land Registry 2021
Figure 6.1: House value increases 2010 to 2020
Source: Land Registry 2021
The private rental market
The private rental sector is becoming an increasingly important part of the housing market. As we have explored in chapter 2 (table 3.6), 23.2% of Torbay households were living in the private rental sector at the time of the Census 2011. This was slightly higher than corresponding percentages in the neighbouring urban areas of Exeter and Plymouth. This contrasts with only 8.1% of households living in the social (affordable) rented sector, which is considerably lower than neighbouring urban boroughs.
Average rental prices for Torbay over the 2020/21 financial year are set out in table 6.4 below. Overall, a lower quartile (LQ) market rent, which is considered an entry level price point, is £495 pcm. LQ rates for rooms, studio and 1 bedroom properties are lower than overall LQ rates. However, family accommodation consisting of 2 or more bedrooms at the LQ rate has a higher entry level.
We have also included, within the table below, the Lower Housing Allowance (LHA) rates at March 2021 for consistency with the rental averages timeline. LHA determines the ceiling amount of Housing Benefit or the housing element of universal credit that will be paid based upon a tenant’s bedroom need. Torbay falls within the South Devon Broad Rental Market Area. LHA is provided at a weekly rate, so we have calculated the equivalent monthly rate for comparative purposes. LHA rates are above lower quartile rent prices for all property sizes excepting room only. The next section considers the prevalence of housing benefit supported tenants within the private rental sector.
| Accommodation | Count | Lower quartile (£) | Median (£) | Mean (£) | LHA rates (£) |
|---|---|---|---|---|---|
| Room | 70 | 329 | 347 | 357 | 281 |
| Studio | 60 | 375 | 415 | 419 | 448.76 |
| 1 bed | 460 | 433 | 475 | 488 | 448.76 |
| 2 bed | 600 | 585 | 650 | 654 | 598.35 |
| 3 bed | 360 | 675 | 750 | 761 | 728 |
| 4 bed | 80 | 895 | 995 | 1,042 | 897.52 |
| All | 1,580 | 495 | 610 | 634 | N/A |
Source: Valuation Office Agency 2021
Department of Work and Pensions (DWP) data is provided on the number of housing benefit (HB) claimants in the rented sector in its entirety. We have mentioned the importance of the private rental sector (PRS) in Torbay and table 6.5 shows that the PRS provides accommodation for a significant number of households in receipt of HB. Nearly 60% of tenants in the PRS are in receipt of HB, compared to 22.6% and 32.2% in Exeter and Plymouth. This places a significant reliance on the PRS to meet the needs of households on lower incomes who are eligible for HB.
This may be due in part to the smaller number of social housing tenancies in Torbay, although it should be noted that the proportion of tenants in receipt of HB in social housing is also higher than in the corresponding areas. In fact, the proportions of tenants overall on HB is higher in Torbay than comparative geographies (refer table 6.6). Table 6.4 above highlights that rental cost at the lower quartile level, aside from the room rate, is below the LHA level. As such the lower end of the private rental sector is affordable to low-income households on housing benefits.
An issue with a large number of HB eligible households being reliant on the PRS is that if there is a change in demand or supply, these households will tend to be squeezed out and left with no other options but to present to the Council. Supply issues may be caused if a significant number of landlords decide to leave the market, and demand issues may be caused if there is an increasing demand from the workforce. The Housing Options service has reported upward pressure on rents, particularly in respect of family accommodation. These observations have yet to feed through statistically and are thought to relate both to the increasing holiday sector demand for short term lets and to households relocating from other areas with a view to purchase.
| Area | All HB Claimants | Social Rented | Private rented |
|---|---|---|---|
| Torbay | 12,298 | 4,128 | 8,171 |
| Exeter | 7,975 | 5,645 | 2,333 |
| Plymouth | 20,547 | 13,454 | 7,095 |
Source: DWP 2018
| Area | All HB Claimants as % of population | Social Rented as % of stock | Private Rented as % of stock |
|---|---|---|---|
| Torbay | 9.00% | 86.70% | 59.70% |
| Exeter | 6.10% | 67.30% | 22.60% |
| Plymouth | 7.80% | 63.80% | 32.20% |
Source: DWP 2018
Affordability
The ONS produces affordability ratios for each local authority. Affordability ratios are the ratio of average house prices to average incomes, with a higher ratio meaning that housing is less affordable. The whole dataset ranges from 2002 to 2020. The earnings data is from the Annual Survey of Hours and Earnings consistent with the source of the analysis of earnings earlier in chapter 5. Earnings relate to gross full-time individual earnings on a place of residence basis. The house price statistics come from the House Price Statistics for Small Areas, which is based upon the median and lower quartile price paid for residential property and refers to a 12 month period with April in the middle (year ending September). These statistics are sourced by way of the Land Registry.
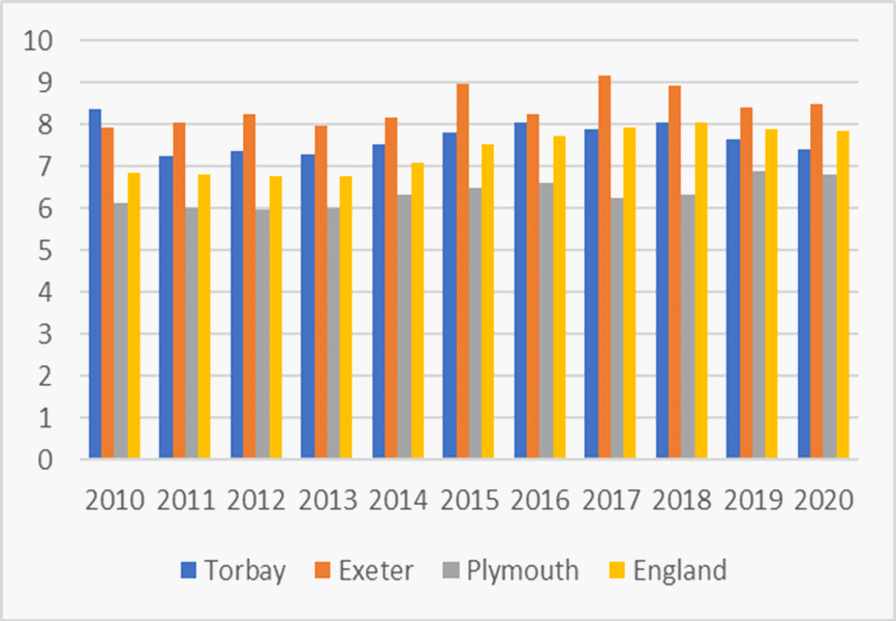
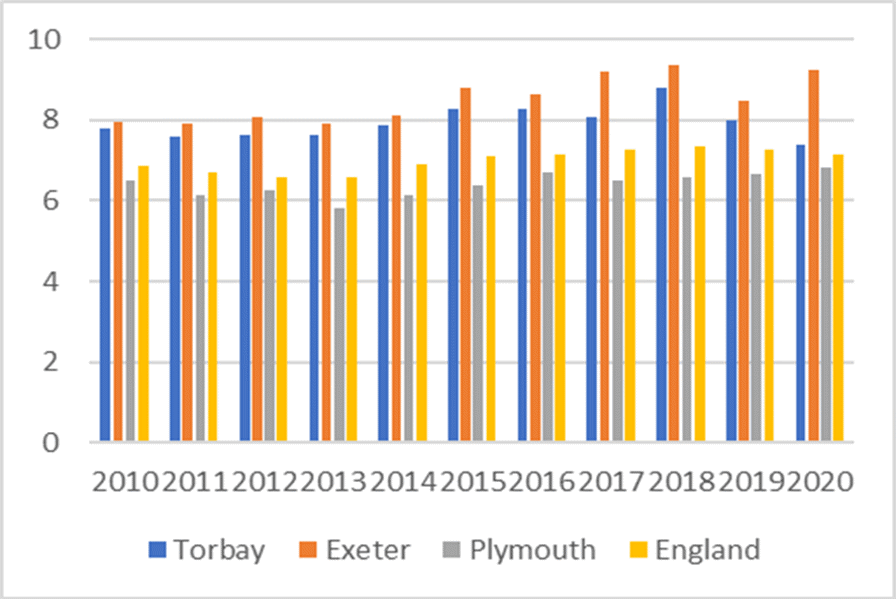
The information in figure 5.1 has already revealed that income differentials between residents and the workforce is not significant. Tables 6.8 and 6.9 show that the resident affordability ratio in Torbay has been relative stable across the median and lower quartile range over the ten year period from 2010 to 2020. There has not been an overall upward trajectory for Torbay residents in contrast to the comparative areas. In 2010 Torbay’s median resident affordability ratio was higher than the comparative geographies, whereas in 2020 Torbay’s ratio was lower than the ratios for England and Plymouth. Over the ten year period median affordability ratios in England have increased by one multiple (c14%) compared to Exeter (c7%) and Plymouth (c11%). The same trend is apparent with lower quartile affordability ratios.
Figure 6.8: Median house price to median gross annual earnings: Residents
Source: DLUHC 2021
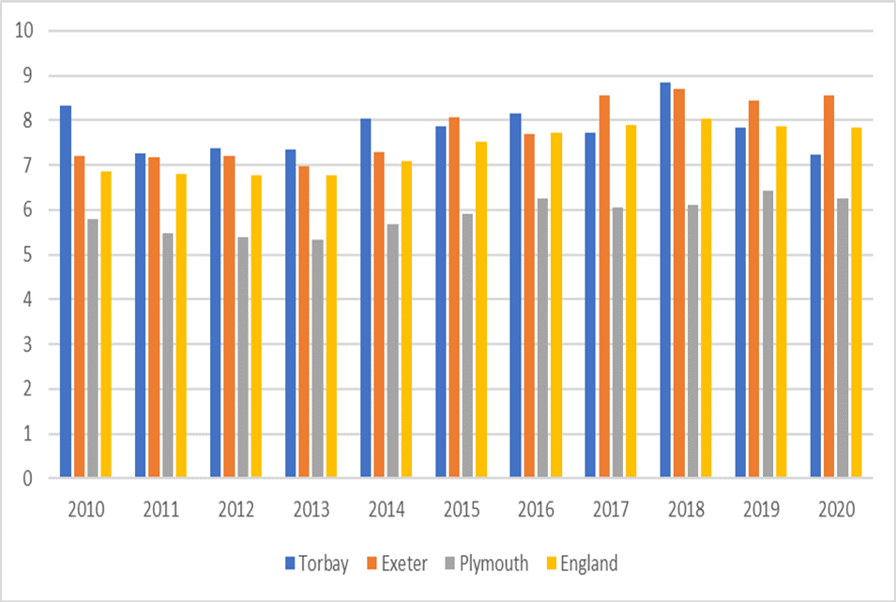
Figure 6.9: LQ house price to LQ gross annual earnings: Residents
Source: DLUHC 2021
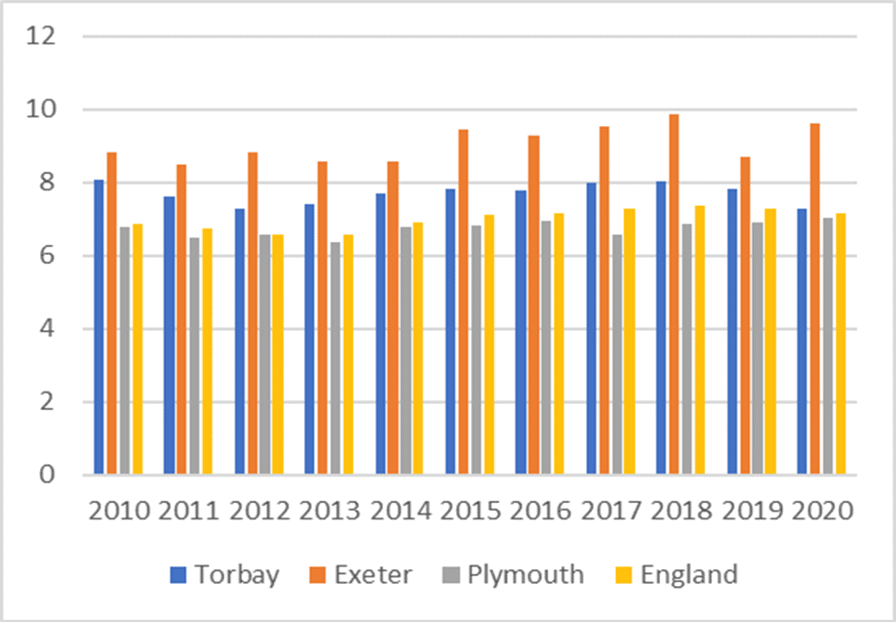
Tables 6.10 and 6.11 illustrate the median and LQ affordability ratios for Torbay’s workforce. We have established that there is not a significant divergence between workforce and resident affordability ratios. The workforce affordability ratios in Plymouth, Exeter and nationally have increased over the period while Torbay’s affordability ratio has seen a relatively level trajectory.
Plymouth’s workplace affordability ratio is slightly lower than its resident affordability ratio which suggests higher earners commute into the city. Torbay’s median workplace affordability ratio is lower than the national average, but the LQ ratio is slightly higher than the national average. Across comparative geographies affordability ratios are highest in Exeter.
Table 6.10: Median house price to median gross annual earnings: Workforce
Source: DLUHC 2021
Figure 6.11: LQ house price to LQ gross annual earnings: Workforce
Source: DLUHC 2021
More in About the council
- How the council works
- Councillors
- Leader of the Council
- Get in touch
- Voting and elections
- Consultations
- Finance and budgets
- Plans, policies and strategies
- Information and data
- Civic Mayor
- Pay an invoice
- Report fraud within or against the council
- Audit
- Achievements, Honours and Awards
- Climate Change
- Our Performance
- Greener Way for Our Bay