Initially we set out the key findings of chapter 8. Note that referencing, data source and context is provided in the body of the chapter.
Key findings
- The private rented sector (PRS) as a % of Torbay’s housing stock rose from 13.5% in 1991 to 23.22% in 2011.
- ONS projections indicate that the PRS then rose to over 27% of stock in 2015 and 2016, before dropping to just over 25% in 2019.
- In respect of the age of the Household Reference Person (HRP), unsurprisingly households with a younger HRP are far more prevalent in the PRS. Circa 74% of households where the HRP is under 25 are living in the PRS. Circa 55% of households where the HRP is between 25 and 34 are living in the PRS.
- Historically, younger households tend to start renting privately and then move onto owner occupation or some form of more secure affordable provision. With market housing continuing to become less affordable in comparison to incomes, the transition from the PRS to owner occupation is becoming more problematic.
- Although the PRS is still typically a younger cohort market, there are still households renting privately where the age of the HRP is much older. 8.8% of households (635 households) where the HRP is between 75 and 84 rent in the PRS. 9.3% of households (312 households) where the HRP is 85 years or over rent privately.
- Torbay Council is required to keep and maintain a register of individuals or associations of individuals who are interested in self-build housing. At the time of writing there are 52 households who have expressed an interest in self-build and custom-build housing.
- In the Census 2011, 13,941 persons in Torbay reported having a long-term health problem or disability that limits their day-to-day activities a lot. Of these, 7,375 were 65 years old or over, which comprises 25.3% of the 65+ population.
- A Housing Learning and Improvement Network (LIN) commissioned report highlighted a lack of both age-suitable housing designated specifically for older people and innovative housing with care options that is adapted/adaptable for later life in Torbay.
- The Housing LIN report set out the following need for older persons’ accommodation to 2035: 848 units of specialist housing for older people (424 for rent and 424 for sale); 276 units of housing with care (138 for rent and 138 for sale); a reduction of 188 residential care beds and an increase of 370 beds for nursing care.
- The Council’s Adult Services department have identified a need to allocate an additional 12 units per annum for persons with a Learning Disability and 3 bespoke units of accommodation per annum.
- The Council’s Adult Services department state that they require an allocation of 15 units per annum to meet the needs of clients with an enduring mental health.
- The Devon Gypsy and Traveller Accommodation Assessment identified a need for 2 pitches in Torbay within the plan period.
- There is currently no measurable student population in Torbay.
PPG on HENA refers to ‘identifying the housing needs of different groups’ and the ‘housing needs of older and disabled people’, and defers to existing PPG.
Identifying the housing needs of different groups
PPG on ‘Advice on addressing the need for different types of housing’ was published on 22 July 2019 and updated on 24 May 2021. This guidance focusses upon:
- The private rental sector
- Self-build and custom housing
- Student housing
The private rental sector
The private rental sector (PRS) is a key element of the housing market in Torbay. The report examines the PRS in Chapter 3 (the Housing Baseline) and more comprehensively in Chapter 6 (the housing market and affordability), and the PRS also forms a key part of the calculation of affordable housing need set out in Chapter 7. This section will refer to the previous information as required without repeating the previous narrative. Nationally the PRS has grown over 20 plus years and since 2011 the private rental sector has been the second largest housing tenure in England behind owner-occupation. This is the case in Torbay at 23.2% (plus 1% living rent free) as outlined in Figure 3.5.
The table below demonstrates the growth in the PRS from the Census 1991 to the Census 2011.
| Year | % housing stock |
|---|---|
| 1991 | 13.5 |
| 2001 | 15.1 |
| 2011 | 23.22 |
The ONS provides dwelling tenure estimates at the local authority area for 2012 to 2019. These estimates are derived from a series of datasets, namely the 2011 Census, the Annual Population Survey household datasets, the English House Condition Survey and the annual DLUHC live tables of dwelling stock. It can be seen from the graph below that it is estimated that the sector grew from 2011 to a peak in 2015 and 2016, before dropping back. There is some anecdotal evidence that tax changes, proposed changes in tenancy rights and more robust legislation have led to a departure of some landlords from the sector.
Figure 8.1: PRS as a proportion of Torbay housing stock 2012 to 2019
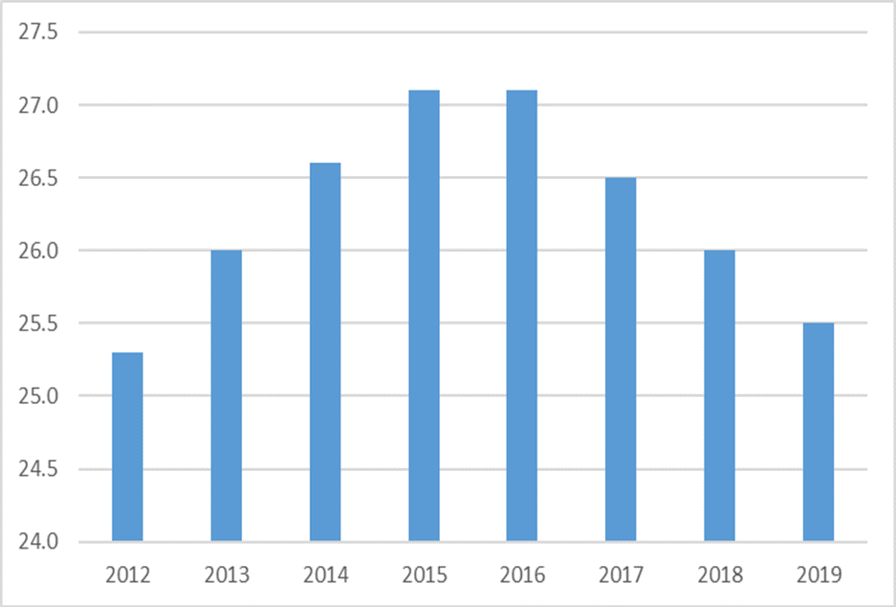
Source: ONS 2021
Demographics of those living in the PRS
The table below sets out the percentage of households living in the private rental sector by the age of the household reference person (HRP) at the time of the Census 2011. Within this assessment, we include those living rent free as these households will have an equivalent security of tenure.
The ‘living rent free’ category represents 1.0% of the total number of households.
Unsurprisingly the highest proportions of households living in the PRS are within the younger age cohorts. However, renting privately is not limited to younger aged cohorts by HRP and possibly somewhat surprising is the number of households renting privately whose HRP is 65 and over. It has to be caveated that renting privately may be a choice for some households and may also be a temporary solution while they seek to buy a property.
| Age cohort | Number of households | % of households in that HRP age cohort |
|---|---|---|
| Age 24 and under | 1,325 | 73.8 |
| Age 25 to 34 | 3,275 | 55.4 |
| Age 35 to 49 | 4,492 | 30.2 |
| Age 50 to 64 | 3,072 | 18.7 |
| Age 65 to 74 | 1,159 | 12.3 |
| Age 75 to 84 | 635 | 8.8 |
| Age 85 and over | 312 | 9.3 |
| All age categories | 14,270 | 24.2 |
Source: Census 2011
Table 8.3 sets out the percentage of households living in the PRS by household composition. 43% of one person households under the age of 65 rent privately in Torbay. As can be seen from the table above this is likely to be weighted toward the younger cohorts.
41.2% of co-habiting couples rent privately compared to 13.4% of married couples or those within a civil partnership. Couples in legal relationships will tend to have an older age profile than cohabiting couples which again reflects the greater prevalence of renting privately amongst younger cohorts. 41% of lone parent households live in the private rented sector.
| Household composition | Number of households | % of households |
|---|---|---|
| One person household: 65 and over | 1,390 | 14.4 |
| One person household: Other | 4,525 | 43 |
| One family only: All 65 and over | 353 | 5.5 |
| One family only: Married or same sex civil partnership | 2,300 | 13.4 |
| One family only: Cohabiting couple | 2,211 | 41.2 |
| One family only: Lone parent | 2,514 | 41 |
| Other household types: With dependent children | 293 | 23.9 |
| Other household types: All full-time students | 16 | 94.1 |
| Other household types: All aged 65 and over | 31 | 10.4 |
| Other household types: Other | 637 | 28.3 |
Source: Census 2011
The private rented sector plays a crucial role in Torbay’s housing market for both younger and lowincome households. In 2018 the DWP reported that just under 60% of Torbay’s private renters were in receipt of housing benefit. This is significantly higher than comparative areas.
Due to the reliance on the PRS for many low-income households, these households are vulnerable to any demand changes within the sector. For example, if demand for PRS accommodation from working adults increases or there is an increase in demand from a new source, for example students or an overseas workforce, then supply in some areas or some property types may be constrained for low-income households. The Council’s Housing Options team indicate that they are struggling to place homeless households in the private sector due in part to a recent overall increase in demand in Torbay for accommodation. Currently there is much as yet unquantified anecdote about the ‘flight to the provinces’ as much of the workforce seek to work from home on a more permanent basis. The step change in working habits and the impact on the housing market has yet to be fully understood.
The Council would be prudent to consider how it can strategically support and improve the sector in order to support low-income households who have limited or no alternative options.
Self-build and custom housing
The Self-build and Custom Housebuilding Act 2015 (as amended by the Housing and Planning Act 2016) provides a legal definition of self-build and custom housebuilding and does not distinguish between the two. It defines both as “where an individual, an association of individuals, or persons working with or for individuals or associations of individuals, build or complete houses to be occupied as homes by those individuals.”
The Act sets a requirement for relevant authorities, which includes Torbay Council, to keep and maintain a self-build register of interested individuals or associations of individuals. Currently there are 52 households who have expressed an interest in self-build and custom-build housing.
The Council is reviewing its sites that may be suitable for self-build allocation by way of its site assessments within the Local Plan Update process.
Student housing
There is no bespoke student accommodation in Torbay and an inconsequentially small number of students living in the local authority area.
Housing needs of older and disabled people
Housing for older people
PPG emphasises that the need to provide housing for older people is critical. PPG goes on the state that the population is living longer and the proportion of older people within the population is thereby increasing. Linked to the ageing of the population is the greater likelihood and prevalence of emerging physical disabilities, dementia and other age-related conditions.
Of the 13,941 persons who, in the Census 2011, reported having a long-term health problem or disability that limits their day-to-day activities a lot, 7,375 were aged 65 or older. This amounts to a quarter (25.3%) of the 65 and older cohort, and 5.8% of the population. A similar number of this age cohort (7,835) reported a long-term health problem or disability that limits their day-to-day activities a little. PPG suggests that “they (plan-making authorities) could also provide indicative figures or a range for the number of units of specialist housing for older people needed across the plan area throughout the plan period.”
PPG states that in mid-2016 there were 1.6 million people aged 85 and over, with this number projected to reach 3.2 million by mid-2041. In this assessment, population and household age is referenced in detail in Chapter 4: Demographic profile. In line with national trends, the rate of population growth is far higher in older cohorts. The graph below from Chapter 4 illustrates this.
Figure 9.2: Population growth by age cohort
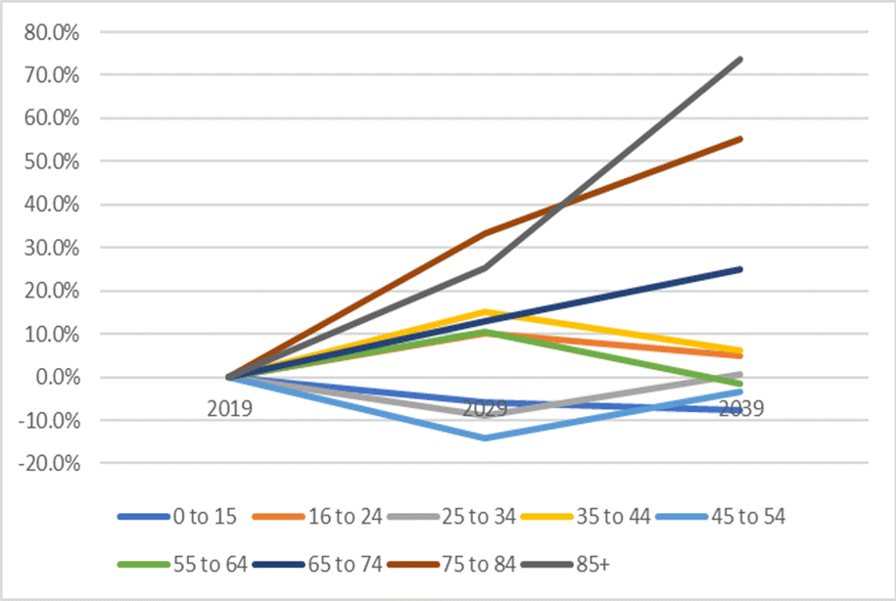
Source: ONS 2021 (Nomisweb)
Torbay Council has produced a Strategy for Housing in Later Life (2020 – 2025). The research to inform this strategy was carried out by the Housing Learning and Improvement Network (Housing LIN). This Strategy is summarised within this assessment. The Strategy and the research that supports it should provide the base evidence for a policy response. The key points of this research are extracted below.
The Housing LIN research highlights that the housing offer for later life in Torbay is currently skewed towards traditional social housing sheltered schemes and private sector leasehold schemes. The report also highlights a lack of both age-suitable housing that is not designated for older people specifically and innovative housing with care options that is adapted/adaptable for later life. In particular there is a lack of housing with care options and sheltered housing for owner occupiers and private renters to reflect the current housing profile in Torbay.
Currently, Torbay has only two Extra Care Housing schemes offering rental and shared ownership apartments to people who qualify for affordable housing. Extra Care Housing in Torbay is not only for older people as schemes are open to people over 18 who have an assessed need for housing with care in order to live independently. There is very limited provision of private sector housing with care for older people. Housing that is specifically designed for older people is concentrated in Torquay and Paignton. There is no housing with care on-site in Brixham. The figure below sets out the numbers of older persons’ housing by type and tenure.
Figure 9.3: Current Older Persons’ housing in Torbay
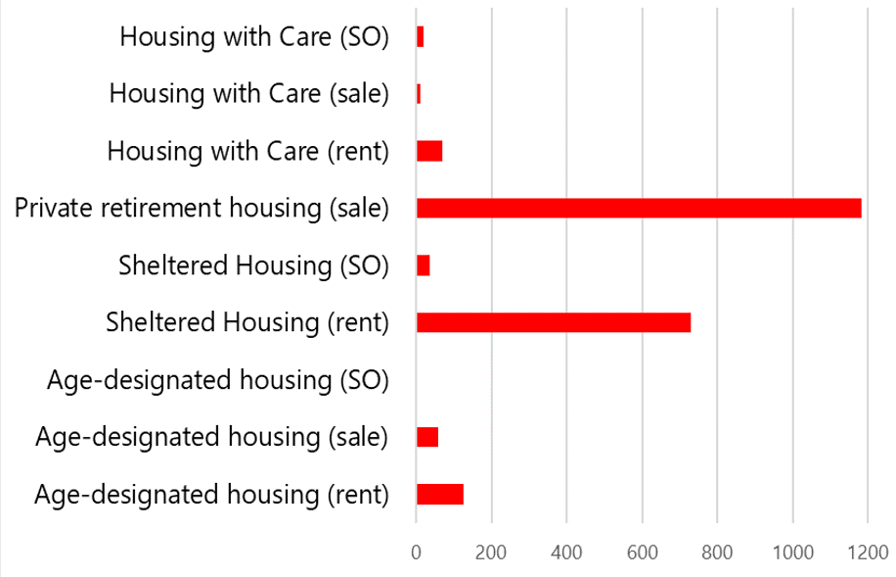
Source: Torbay Council, Housing LIN report
Housing LIN were commissioned to apply their ‘Strategic Housing for Older People’ (SHOP@) approach to model future need for specialist housing for older people in Torbay up to 2040. SHOP@ was originally developed with the Association of Directors of Adult Social Services
(ADASS) and Elderly Accommodation Counsel (EAC) for the Department of Health’s Market Development Forum to support local authorities with forecasting demand for older people’s housing. The SHOP@ housing need assessment tool has been updated to refine the previous use of national generic ‘benchmarks’ to predict future need at local authority level. The comparative analysis applied compares the current supply or ‘prevalence’ of different types of housing and accommodation for older people in Torbay with comparator local authorities (i.e., similar unitary local authorities) as well as with the average supply of older people’s housing and accommodation across England as a whole.
| Housing/accommodation type | 2019 current provision (units/beds) | 2035 estimated need | 2035 net need (units/beds) |
|---|---|---|---|
| Housing for Older People | 2128 | 2976 | 848 |
| Housing with Care | 100 | 376 | 276 |
| Residential Care | 1267 | 1079 | -188 |
| Nursing Care | 508 | 878 | 370 |
Source: Torbay Council, Housing LIN report
In summary this indicates that the estimated net requirements for Torbay to 2035 are:
- Housing for older people: 848 units of which 424 for rent and 424 for sale.
- Housing with care: 276 units of which 138 for rent and 138 for sale.
- Residential care: a reduction of 188 beds.
- Nursing care: 370 beds.
Hence in light of PPG the local plan-making authority can set indicative annual figures for specialist older person over the plan period.
Housing for people with disabilities
PPG states that “the provision of appropriate housing for people with disabilities, including specialist and supported housing, is crucial in helping them to live safe and independent lives.” Lack of suitably adapted or appropriate housing can lead to mobility issues inside and outside the home, and difficulties for carers. This leads to poorer outcomes and opportunities for many disabled people with consequent impacts on the mental health and well-being of the disabled person, their families and carers.
The provision of more suitable accommodation can enable disabled people to live more independently and safely, and provides them with greater choices and control over their lives. The ageing of the population will lead to greater numbers of disabled people. PPG stresses the importance of planning for the provision of suitable housing to meet the needs of disabled people throughout their lifetime.
PPG goes on to state: “Plan-making authorities should set clear policies to address the housing needs of groups with particular needs such as older and disabled people. These policies can set out how the plan-making authority will consider proposals for the different types of housing that these groups are likely to require.”
The Census 2011 identified 13,941 persons in Torbay who reported a long-term health problem or disability that limits their day to day activities a lot. That amounts to 10.9% of the overall population. A further 15,490 (12.1%) persons reported a long-term health problem or disability that limits their day to day activities a little.
Of those whose condition limits their day-to-day activities a lot, the age distribution is set out in the table below. This clearly shows a relationship between ageing and the prevalence of disability and long-term ill-health. It needs to be noted that some of the most severe forms of disability are congenital from birth and often this cohort faces the greatest challenges in terms of housing.
| Age category | No. | % of age cohort |
|---|---|---|
| 0 to 15 | 386 | 1.79 |
| 16 to 49 | 2,817 | 5.6 |
| 50 to 64 | 3,363 | 12.53 |
| 65 and over | 7,375 | 25.26 |
| Total | 13,941 | 10.9 |
Source: Census 2011
The Projecting Adult Needs and Service Information (PANSI) system is produced by the Institute of Public Care at Oxford Brookes University and is seen as the key information source for projections relating to the housing needs of adults with a disability or special need. The following sections set out projected numbers of Torbay’s population with a disability or special need.
The table below shows the proportion of the population projected to have a severe or moderate learning disability. 2.3% of all adults and 2.4% of adults between the ages of 18 and 64 are projected to have a learning disability. The proportion of adults with a learning disability is weighted towards the lower age cohorts, which demonstrates that learning disabilities are not linked to ageing in the way that some other disabilities or long-term health problems are.
The Council’s Adult Services department have identified a need to allocate an additional 12 units per annum for persons with a Learning Disability and 3 bespoke units of accommodation per annum.
| Age | 2020 | % of age cohort | 2030 | Growth |
|---|---|---|---|---|
| 18 to 24 | 224 | 2.7 | 249 | 25 |
| 25 to 34 | 349 | 2.49 | 316 | -33 |
| 35 to 44 | 335 | 2.46 | 382 | 47 |
| 45 to 54 | 428 | 2.35 | 387 | -41 |
| 55 to 64 | 468 | 2.27 | 486 | 18 |
| Total 18 to 64 | 1804 | 2.41 | 1820 | 16 |
| 65 to 74 | 421 | 2.18 | 487 | 66 |
| 75 to 84 | 252 | 2.02 | 327 | 75 |
| 85 and over | 100 | 1.95 | 132 | 32 |
| Total | 2,577 | 2.31 | 2,765 | 188 |
Source: PANSI 2021
For many categories of special needs, the Projecting Adult Needs and Service Information (PANSI) reports on prevalence only within the sector of the population that is aged 18-64. This is the case with the population projected to have impaired mobility. Tables 9.7 and 9.8 set the projected growth in the number of adults under 65 with impaired mobility or a moderate or serious personal care disability. Overall mobility and care needs should also be viewed in the context of the ageing population needs referenced in the previous section. Policy H6 (Housing for people in need of care) of the current Local Plan sets out a number of criteria that facilitate the delivery of a proportion of dwellings built in accordance with Part M4(2) (accessible and adaptable dwellings) of the Building Regulations. The evidence indicates that Policy H6 should be maintained as a minimum and that increased provision could be considered as part of an authority wide viability assessment.
| Age | 2020 | % of age cohort | 2030 | Growth |
|---|---|---|---|---|
| 18 to 24 | 83 | 1 | 93 | 10 |
| 25 to 34 | 140 | 1 | 127 | -13 |
| 35 to 44 | 680 | 5 | 770 | 90 |
| 45 to 54 | 910 | 5 | 815 | -95 |
| 55 to 64 | 2,884 | 14 | 2,996 | 112 |
| Total | 4,697 | 4.21 | 4,801 | 104 |
Source: PANSI 2021
| Age | 2020 | % of age cohort | 2030 | Growth |
|---|---|---|---|---|
| 18 to 24 | 83 | 1 | 93 | 10 |
| 25 to 34 | 252 | 1.8 | 229 | -26 |
| 35 to 44 | 476 | 3.5 | 539 | 63 |
| 45 to 54 | 1092 | 6 | 978 | -114 |
| 55 to 64 | 2163 | 10.5 | 2247 | 84 |
| Total | 4066 | 5.44 | 4086 | 20 |
Source: PANSI 2021
Table 9.9 below excludes what are described as common mental disorders, such as depression or anxiety, which are commonly treated through general practice. It also excludes dementia related mental health issues which are predominantly associated with ageing, although not exclusively.
The Council’s Adult Services department state that they require an allocation of 15 units per annum to meet the needs of clients with an enduring mental health issue, although some of these units can be sourced within the existing housing market. The table below indicates the total projected number of persons with these disorders listed in Torbay.
| Disorder | 2020 | % of age cohort (18-65) | 2030 | Growth |
|---|---|---|---|---|
| Borderline personality disorder | 1,799 | 2.41 | 1,799 | 0 |
| Anti-social personality disorder | 2,493 | 3.34 | 2,516 | 23 |
| Psychotic disorder | 524 | 0.7 | 525 | 1 |
| Two or more psychiatric disorders | 5,388 | 7.21 | 5,399 | 11 |
Source: PANSI 2021
Gypsies and travellers
The accommodation needs of Gypsies and Travellers are typically considered within a bespoke assessment. The Devon Gypsy and Traveller Accommodation Assessment (GTAA) 2015 is the most recent study for the purposes of assessing Gypsy and Traveller accommodation needs. There are currently no pitches either permanent or transit within Torbay. However, the GTAA identified 13 gypsies and travellers in living in mainstream ‘bricks and mortar’ accommodation. The GTAA follows the latest government guidance in calculating the future requirement for pitches. This assessment identifies the need for 2 pitches in Torbay within the plan period. It also identifies a housing (bricks and mortar) need for 4 households. There is also an identified need for 4 to 5 transit sites across the County without specific location being referred to.
More in About the council
- How the council works
- Councillors
- Leader of the Council
- Get in touch
- Voting and elections
- Consultations
- Finance and budgets
- Plans, policies and strategies
- Information and data
- Civic Mayor
- Pay an invoice
- Report fraud within or against the council
- Audit
- Achievements, Honours and Awards
- Climate Change
- Our Performance
- Greener Way for Our Bay