Introduction
- Torbay Local Authority (LA) has a statutory duty to ensure all children of school age can access education. Pupil projections provide an indicator for the expected school population over the coming 5 years enabling the LA to plan provision and ensure it has sufficient capacity to meet demand.
- Our projections are estimates based on historical trends; the assumption is that patterns and trends affecting current pupil numbers will continue as they are. The projections are updated bi-annually to ensure they reflect the most up to date data and local intelligence.
- Projections are provided for each of the LA’s recognised planning areas, Torquay, Paignton, and Brixham. Due to the size of our planning areas, the proximity and number of schools within each and the impact of parental preference, the projections cannot reliably be broken down any further. The split of pupils between each of the schools within an area varies year on year depending on availability of places, popularity, and other variables, such as parents choosing a school influenced by their daily commute. Any assumptions the LA could make on historic admissions would be misleading and unreliable information to share with schools.
- This Executive Summary provides an overview of the current and projected pupil numbers for each planning area across the primary and secondary sectors. Along with historic data as a reference.
- It outlines the implications for school places and the LA’s actions for managing future provision.
- There are three key factors affecting Torbay’s current projections;
-
- persistent small number of births across all three planning areas; consistent with national trend,
- the reduced impact of population growth with a slowdown in housing and movement into the area,
- and high levels of inward migration, at secondary level, to the selective schools.
- As a result, the LA is forecasting high levels of surplus capacity (exceeding the 10% surplus it aims to keep for parental preference and in year admissions) in both sectors and across all three planning areas.
- The LAs focus is on managing the immediate impact on the primary sector and looking long term at the potential impact on the secondary sector.
- In addition, the LA is awaiting the outcome of the Local Government Reorganisation (LGR); a decision is expected this summer. A reorganisation could trigger significant changes to the LA and have an impact on future place planning. How and when is unclear at this time, but the LA will maintain a watching brief and share information and any implications as they become available.
For further information on School Place Planning please contact:
Clare Talbot. Head of Education (School Place Planning and Capital), Education Team, 01803 208220. clare.talbot@torbay.gov.uk
Samantha Poston. Team Leader, Education Team, 01803 208260, samantha.poston@torbay.gov.uk
Planning area: Torquay
Primary actual and projected numbers on roll
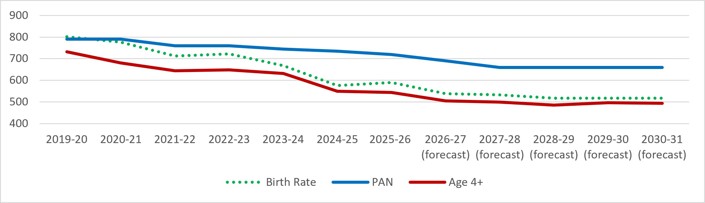
The above graph charts the historic and projected primary intake against the PAN capacity, with the corresponding birth rate for that cohort group. From 2019 there has been a steady decline in the primary intake mirroring the drop in birth rates in the area. The birth rate now shows signs of stabilising at this lower level.
A new housing development of 550 homes proposed for the Edginswell area will generate some future pupil growth but not at a level to use all surplus capacity. The development is still in negotiations with no immediate start date.
Current projections show that by 2030 the level of surplus capacity could be 25%; this equates to 5FE.
| Academic Year | PAN | Rec | Year 1 | Year 2 | Year 3 | Year 4 | Year 5 | Year 6 | Total |
|---|---|---|---|---|---|---|---|---|---|
| 2025-26 (actual) | 720 | 543 | 556 | 637 | 640 | 647 | 685 | 723 | 4431 |
| 2026-27 (forecast) | 690 | 504 | 552 | 548 | 633 | 640 | 641 | 685 | 4203 |
| 2027-28 (forecast) | 660 | 499 | 512 | 544 | 545 | 633 | 634 | 641 | 4008 |
| 2028-29 (forecast) | 660 | 485 | 507 | 505 | 541 | 545 | 627 | 634 | 3844 |
| 2029-30 (forecast) | 660 | 485 | 492 | 500 | 502 | 541 | 539 | 627 | 3686 |
| 2030-31 (forecast) | 660 | 489 | 492 | 486 | 497 | 502 | 535 | 540 | 3541 |
It is not possible for the LA to project how the falling numbers will impact individual schools, however, six local schools (in bold below) have lowered their PANs to manage the impact of falling numbers.
The Planned Admission Numbers (PAN) expected for 2027 are:
All Saints Babbacombe Church of England Primary School:30
Barton Hill Academy: 60
Cockington Primary School: 60
Ellacombe Academy: 50
Homelands Primary School: 30
Ilsham Church of England Primary School: 25
Our Lady of the Angels Roman Catholic Primary School: 30
Priory Roman Catholic Primary School: 15
Sherwell Valley Primary School: 90
Shiphay Learning Academy: 30
St Margaret’s Academy: 60
St Marychurch Church of England Primary School: 30
Torre Church of England Primary School: 45
Upton St James Church of England Primary School: 15
Warberry Church of England Primary School: 60
Watcombe Primary School: 30
Secondary actual and projected numbers on roll
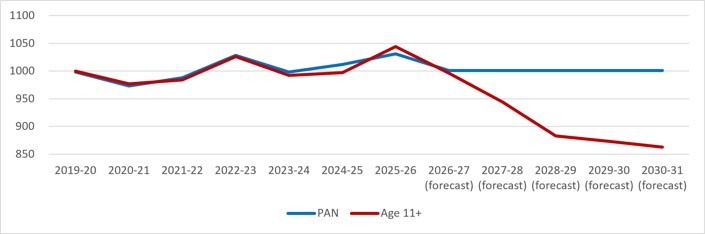
The above graph shows the historic and projected secondary intake against the available PAN capacity in the area. The LA currently faces the challenge of managing the demand from the last remaining large cohorts moving up alongside high levels of inward migration to the selective schools.
Secondary intake numbers peak in 2026 before dropping to more manageable levels as smaller cohorts move up. The table below provides the projected secondary numbers and shows that by 2030 the level of surplus capacity could reach 14%; this equates to 4FE; but this position could change quite rapidly.
Historically, the area experiences a high level of inward migration due to the selective schools, for example, in 2025 the Year 7 cohort ‘grew’ by 39%. There is, therefore, an expectation that despite cohort numbers falling, the selective school will continue to fill to capacity, and this will have a positive impact on future projections.
| Academic Year | PAN | Year 7 | Year 8 | Year 9 | Year 10 | Year 11 | Total |
|---|---|---|---|---|---|---|---|
| 2025-26 (actual) | 1031 | 1044 | 982 | 978 | 943 | 908 | 4855 |
| 2026-27 (forecast) | 1005 | 996 | 1039 | 968 | 933 | 922 | 4848 |
| 2027-28 (forecast) | 1005 | 944 | 981 | 1014 | 923 | 912 | 4774 |
| 2028-29 (forecast) | 1005 | 883 | 930 | 967 | 967 | 903 | 4650 |
| 2029-30 (forecast) | 1005 | 873 | 870 | 916 | 922 | 946 | 4527 |
| 2030-31 (forecast) | 1005 | 863 | 860 | 857 | 874 | 902 | 4356 |
There are five secondary schools within this planning area and their expected PANs for 2027 are:
St Cuthbert Mayne Joint Catholic & Church of England School: 195
The Spires College: 210
Torquay Academy: 240
Torquay Boys’ Grammar School: 168
Torquay Girls’ Grammar School: 192
Actions for the Torquay Planning area
- To continue discussions with local Primary heads and Trusts about reducing PAN and utilising surplus accommodation for SEND, Family Best Start Hubs and Early Years provision – capital funding is available for these options from the DfE who recognise falling rolls as a national issue.
- There are currently no proposals to permanently remove any primary accommodation; the LA removed all unfit accommodation during earlier periods of falling rolls (pre-2010).
- The LA will continue a dialogue with planners over the proposed Edginswell development to understand the size of the development and delivery dates to ensure sufficient capacity is maintained.
- Latest position following Secondary Allocation Day in March is that all pupils that have applied to date have been offered a place for this September. Capacity for 2026 remains a challenge and there are pressure points which the LA is closely monitoring; however, no additional capacity is proposed as numbers will drop from 2027.
- The LA will closely monitor transfer rates at Year 7 and the level of inward migration to see how this will mitigate against secondary falling rolls and update its projections as data becomes available.
Planning area: Paignton
Primary actual and projected numbers on roll
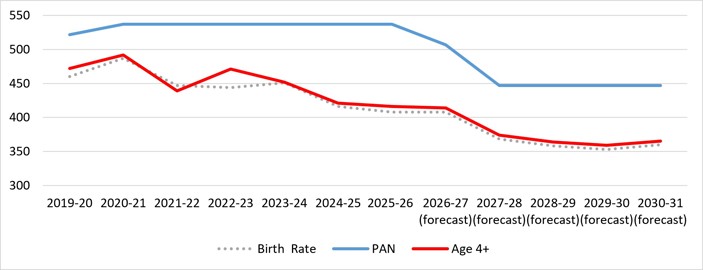
The above graph charts the historic and projected primary intake against the PAN capacity, with the corresponding birth rate for that cohort group. The birth rate has remained below 370 per year for the last 3 years and now shows signs of stabilising at around 360 per year, which is 26% lower than the rate 10 years ago. The primary intake has dropped to mirror the birth rate.
Although Paignton continues to be an area of significant economic investment and large housing developments, the expected pupil growth from developments such as White Rock, Inglewood and Collaton has coincided with the drop in birth rate. Whilst some population growth has helped to mitigate some impact, the LA is currently projecting a surplus capacity of 16% by 2030; this equates to 2 FE.
| Academic Year | PAN | Rec | Year 1 | Year 2 | Year 3 | Year 4 | Year 5 | Year 6 | Total |
|---|---|---|---|---|---|---|---|---|---|
| 2025-26 (actual) | 537 | 416 | 402 | 442 | 481 | 466 | 486 | 475 | 3168 |
| 2026-27 (forecast) | 507 | 414 | 403 | 403 | 449 | 475 | 459 | 487 | 3090 |
| 2027-28 (forecast) | 447 | 374 | 402 | 404 | 409 | 444 | 468 | 460 | 2961 |
| 2028-29 (forecast) | 447 | 364 | 362 | 403 | 411 | 404 | 437 | 469 | 2850 |
| 2029-30 (forecast) | 447 | 359 | 353 | 363 | 409 | 406 | 398 | 438 | 2726 |
| 2030-31 (forecast) | 447 | 365 | 348 | 353 | 369 | 404 | 400 | 399 | 2638 |
Although it is not possible for the LA to project how the falling numbers will affect individual schools, four local schools (in bold below) have lowered their PANs to manage the impact of falling numbers.
The PANs expected for 2027 are:
Collaton St Mary Church of England Primary School: 30
Curledge Street Academy: 60
Hayes School: 57
Kings Ash Academy: 30
Oldway Primary School: 60
Preston Primary School: 45
Roselands Primary School: 45
Sacred Heart Catholic Primary School: 30
St Michael’s Academy: 30
White Rock Primary School: 60
Secondary actual and projected numbers on roll
The above graph shows the historic and projected secondary intake against the available PAN capacity in the area.
Secondary numbers in the area have peaked and are projected to drop in line with what is happening in the primary sector as the smaller cohorts move up.
By 2030 the LA is forecasting 19% surplus capacity in the admitting year which equates to 2FE.
| Academic Year | PAN | Year 7 | Year 8 | Year 9 | Year 10 | Year 11 | Total |
|---|---|---|---|---|---|---|---|
| 2025-26 (actual) | 360 | 355 | 328 | 336 | 264 | 286 | 1569 |
| 2026-27 (forecast) | 360 | 315 | 334 | 308 | 291 | 263 | 1511 |
| 2027-28 (forecast) | 360 | 323 | 296 | 314 | 267 | 289 | 1489 |
| 2028-29 (forecast) | 360 | 306 | 304 | 279 | 271 | 265 | 1425 |
| 2029-30 (forecast) | 360 | 311 | 287 | 286 | 241 | 270 | 1395 |
| 2030-31 (forecast) | 360 | 291 | 293 | 270 | 247 | 240 | 1341 |
There is only the one secondary school in this area, and it will provide sufficient capacity for the current and projected numbers for the area.
The secondary PAN for 2027 is:
Paignton Academy: 360
Actions for the Paignton Planning area
- To continue discussions with local Primary heads and Trusts about reducing their PAN and utilising surplus accommodation for SEND, Best Start Family Hubs and Early Years provision – capital funding is available for these options from the DfE who recognise primary falling rolls as a national issue.
- There are currently no proposals to permanently remove any accommodation; the LA removed all unfit accommodation during earlier periods of falling rolls (pre-2010).
- The LA will continue consulting closely with planners on the build out rate and local impact of above local developments. Any growth will use some surplus although the challenge is often the location of the available places.
- Latest position following Secondary Allocation Day in March is that all pupils that have applied to date have been offered a place for this September.
- The LA will be consulting with the local Academy Trust to manage the impact of falling rolls.
Planning area: Brixham
Primary actual and projected numbers on roll
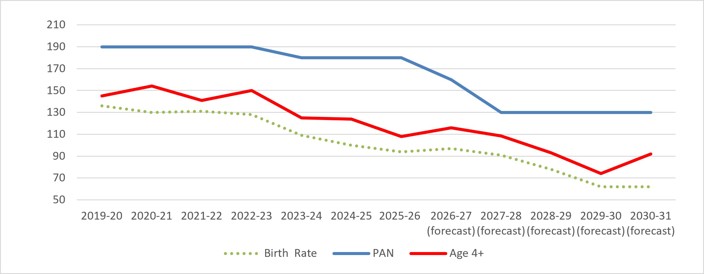
The above graph charts the historic and projected primary intake against the PAN capacity, with the corresponding birth rate for that cohort group. As it shows, there has been a steady decline in the primary intake since 2019, mirroring the drop in birth rates in the area.
With no current or proposed housing developments above historical levels, this position is unlikely to change soon.
Current projections show that by 2030 the level of surplus within the Reception PAN capacity will be 21%; this equates to 1FE.
| Academic Year | PAN | Rec | Year 1 | Year 2 | Year 3 | Year 4 | Year 5 | Year 6 | Total |
|---|---|---|---|---|---|---|---|---|---|
| 2025-26 (actual) | 180 | 108 | 127 | 122 | 150 | 142 | 168 | 138 | 955 |
| 2026-27 (forecast) | 160 | 116 | 109 | 126 | 125 | 146 | 145 | 165 | 932 |
| 2027-28 (forecast) | 130 | 109 | 117 | 108 | 129 | 122 | 149 | 142 | 876 |
| 2028-29 (forecast) | 130 | 93 | 110 | 115 | 110 | 126 | 124 | 147 | 825 |
| 2029-30 (forecast) | 130 | 74 | 94 | 108 | 118 | 108 | 128 | 122 | 752 |
| 2030-31 (forecast) | 130 | 92 | 75 | 93 | 111 | 116 | 110 | 126 | 723 |
Although it is not possible for the LA to project how the falling numbers will affect individual, three local schools (in bold below) have lowered their PANs to manage the impact of falling numbers.
The PANs expected for 2027 are:
Brixham Church of England Primary School: 30
Eden Park Primary School: 30
Furzeham Primary School: 30
Galmpton Church of England Primary School: 30
St Margaret Clitherow Primary School: 10
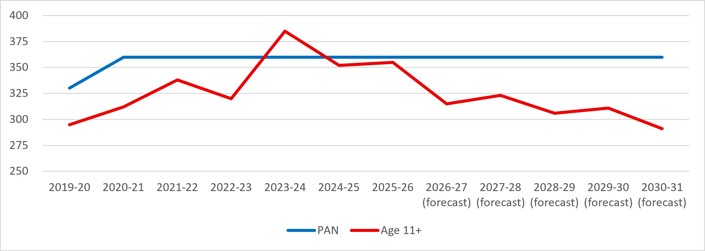
Secondary actual and projected numbers on roll
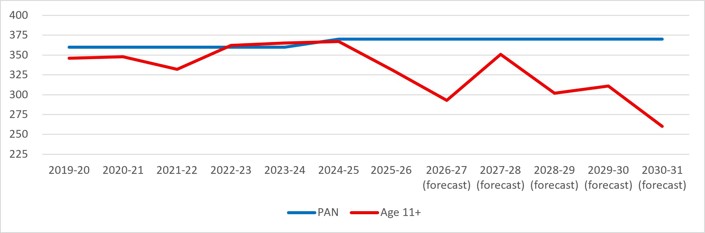
From 2026, secondary numbers are expected to fall significantly as the smaller primary cohorts move up. This is illustrated in the graph above which shows both historic and projected intake numbers. Brixham has seen the most dramatic fall in birth rates with little or no growth from new housing in the area.
By 2030 the LA is forecasting a surplus of 30% which equates to 3FE; but this position could change quite rapidly.
Historically, the area experiences a high level of inward migration due to the selective school, for example, in 2025 the Year 7 cohort ‘grew’ by 99%. There is, therefore, an expectation that despite cohort numbers falling, the selective school will continue to fill to capacity, and this will have a positive impact on future projections.
| Academic Year | PAN | Year 7 | Year 8 | Year 9 | Year 10 | Year 11 | Total |
|---|---|---|---|---|---|---|---|
| 2025-26 (actual) | 370 | 331 | 365 | 360 | 317 | 300 | 1673 |
| 2026-27 (forecast) | 370 | 293 | 327 | 362 | 320 | 306 | 1608 |
| 2027-28 (forecast) | 370 | 351 | 289 | 324 | 322 | 310 | 1596 |
| 2028-29 (forecast) | 370 | 302 | 346 | 287 | 288 | 311 | 1534 |
| 2029-30 (forecast) | 370 | 311 | 298 | 344 | 255 | 279 | 1487 |
| 2030-31 (forecast) | 370 | 260 | 307 | 296 | 306 | 247 | 1416 |
There are two secondary schools within this planning area and their expected PANs for 2027 are:
Brixham College: 210
Churston Ferrers Grammar School: 160
Actions for the Brixham planning area
- To continue discussions with local Primary heads and Trusts regarding reducing their PAN utilising surplus accommodation for SEND, Best Start Family Hubs and Early Years provision – capital funding is available for these options from the DfE who recognise primary falling rolls as a national issue.
- There are currently no proposals to permanently remove any accommodation; the LA has removed all unfit accommodation during previous periods of falling rolls pre-2010.
- Latest position following Secondary Allocation Day in March is that all pupils that have applied to date have been offered a place for this September.
- No further action is needed to meet demand in the area for secondary provision.
- Although current forecasts project a signification level of surplus in 2030, the LA will closely monitor transfer rates at Year 7 and the level of inward migration to see how this will mitigate against secondary falling rolls and update its projections as data becomes available.